
What you need to know
- 6.3Lag, exponential, stationary and death phases, and calculation of the exponential growth rate constantk: the number of doublings per unit time in the exponential phase. k = (log₁₀ Nₜ − log₁₀ N₀) ÷ (t log₁₀ 2)..
How you measure N is 6A 5 and CP13. Aseptic handling is 6A 4. Chemostats are enrichment: the specification curve is a closed culture.
By the end, you should be able to…
- Name lag, exponential, stationary and death phases in order.
- Explain each phase with nutrients, enzymeA globular protein that acts as a biological catalyst, speeding up a specific reaction. or toxins.
- Calculate k = (log₁₀ Nₜ − log₁₀ N₀) / (t log₁₀ 2) from exponential-phase counts.
Build your understanding
Closed broth, four phases
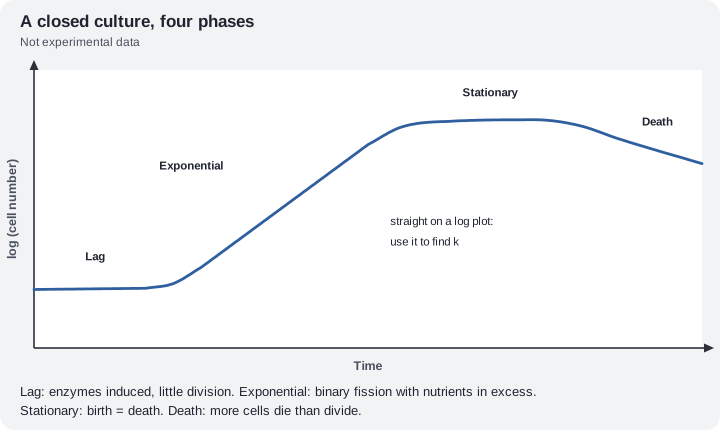
In a closed culture nothing is added and waste is not removed. Plot log cell number against time. Lag: cells take up nutrients and synthesise enzymeA globular protein that acts as a biological catalyst, speeding up a specific reaction.; number barely rises. Exponential (log): binary fissionAsexual reproduction in prokaryotes: the DNA is copied and the cell divides into two. with nutrients in excess; number doubles at a regular interval and the log plot is a straight line.
Stationary: nutrients run down and toxic metabolites build up, so death rate equals division rate and the line levels. Death (decline): more cells die than divide, so number falls. Do not invent extra named phases. “Log phase” in some notes is this exponential phaseThe phase when cells divide at a constant, maximum rate, so numbers double at regular intervals., not a fifth stage.
Follow the process
Closed culture, nothing added and waste stays: lag (enzymes and uptake, little change in number) → exponential, also called the log phase (binary fission while nutrients are in excess, regular doubling) → stationary (nutrients down and/or toxins up, division about equal to death) → death (more death than division, so the number falls). Use only the exponential stretch for k. Counts from lag or stationary phaseThe phase when the population stays constant because the rate of cell division equals the death rate. do not belong in the formula.
Why a log axis
Raw number against time steepens through the exponential phase and hides the early counts. Log number makes that phase a straight line and lets you see lag, plateau and decline on one graph. k is defined for the exponential section only.
A continuously fed culture (a chemostat) can be held in exponential growth. That is enrichment. School and specification curves are closed unless a question says otherwise.
The growth-rate constant
Use k = (log₁₀ Nₜ − log₁₀ N₀) / (t log₁₀ 2), with N₀ and Nₜ from the exponential phase and t the time between them. log₁₀ 2 is given as 0.301 in calculations here. Units are time⁻¹, often h⁻¹. k is the number of doublings per unit time.
Fictional example, labelled as such: a culture grows from 4.00 × 10³ to 4.00 × 10⁶ cells in 6.00 h of exponential growth. log₁₀(Nₜ/N₀) = 3.00. k = 3.00 / (6.00 × 0.301) = 1.66 h⁻¹ (3 s.f.). Counts from stationary phase must not be used.
| Phase | Number | Limitation |
|---|---|---|
| Lag | Little change | Enzymes and uptake not yet ready |
| Exponential | Doubles regularly | None yet; nutrients in excess |
| Stationary | Roughly constant | Nutrients and/or toxins; birth = death |
| Death | Falls | More death than binary fission |
Graph skills: SLAPUK and choosing a scaleTwo data sets on one graph need a key.
Make your reasoning visible
Build the explanation
X happens because Y, leading to Z. X: k is calculated from two exponential-phase counts. Y: only then is doubling regular and the log plot a straight line. Z: a lag or stationary count would invent a growth rate the culture does not have. Incomplete: “k is how fast bacteria always grow.” Improved: “k = (log₁₀ Nₜ − log₁₀ N₀) / (t log₁₀ 2), using two points on the exponential phaseThe phase when cells divide at a constant, maximum rate, so numbers double at regular intervals., so the units are time⁻¹.”
Name binary fission in exponential answers
“They grow fast” is not a mechanism.
Refuse stationary numbers for k
Birth already equals death, so the population is not doubling.
Avoid this misconception
The claim: stationary phaseThe phase when the population stays constant because the rate of cell division equals the death rate. means the bacteria have all died.
The correction: Number is roughly constant because division still balances death. The fall comes in the death phase.
Check your understanding
Try each question before opening the suggested answer.
Check your understanding (continued)
Practice question
Retrieval and explanation · suggested answer
Name the four phases of a closed bacterial growth curve in order.
Show suggested answer
Lag, exponential (log), stationary, death (decline).
Practice question
Retrieval and explanation · suggested answer
What are cells doing in lag phase?
Show suggested answer
Taking up nutrients and synthesising enzymes; there is little or no increase in number.
Practice question
Retrieval and explanation · suggested answer
Why does a culture enter stationary phase?
Show suggested answer
Nutrients become limiting and/or toxic wastes accumulate, so death rate rises to equal division rate.
Practice question
Retrieval and explanation · suggested answer
N₀ = 2.00 × 10⁴, Nₜ = 2.00 × 10⁷, t = 5.00 h, log₁₀ 2 = 0.301. Calculate k.
Show suggested answer
log₁₀(Nₜ/N₀) = 3.00; k = 3.00 / (5.00 × 0.301) = 1.99 h⁻¹ (3 s.f.). Fictional counts.
Take the idea further
Apply the same specification knowledge to an unfamiliar problem. Any extra assumptions are supplied in the question.
Stretch question
A student calculates k using absorbance 0.10 at 1 h and 0.80 at 4 h from a colorimeter, including the lag. Give two reasons the value is not a valid 6.3 constant, assuming the numbers are fictional.
Show a hint
Phase and what turbidity counts.
Explore the reasoning
k needs two exponential-phase cell numbers, not a lag reading. Absorbance is not N: it includes dead cells and is not on a log-cell scale unless converted. Identify the straight log section first, then use N or a justified log measure from that section only.
Recall this lesson
Lesson recall questions
Question 1 of 5: State what bacteria are doing during the lag phase.
Bacterial growth curve
Practice question
Retrieval and explanation · suggested answer
State what bacteria are doing during the lag phase.
Lesson: 6A 3: The Growth of Bacterial Colonies
Try this from memory first.
Put your biology to work
Explore where these ideas appear in the world. Enrichment, not extra required recall.
The school flask is not an industrial fermenter
6A · The Growth of Bacterial ColoniesThe Microbiology Society describes microbes as growing where nutrients and conditions allow, which is the same four-phase logic in a closed flask. Industrial fermenters often add feed and…Specification 6.3Read & use the scienceClose article
Why this matters
The Microbiology Society describes microbes as growing where nutrients and conditions allow, which is the same four-phase logic in a closed flask. Industrial fermenters often add feed and remove waste so the culture stays productive. That engineering is enrichment. 6.3 still wants lag, exponential, stationary, death and a k from the exponential line. In batch culture, stationary phase can occur when nutrients run low or inhibitory products accumulate. A continuous process changes the inputs and outputs, so its curve cannot simply be labelled with all four school phases.
Back to the specification
Pearson Edexcel IAL Biology · Issue 2, February 2021 · Unit 4, pp. 29–32. The application extends beyond required recall.
- 6.3 understand the different phases of a bacterial growth curve (lag phase, exponential phase, stationary phase and death phase) and be able to calculate exponential growth rate constants
Use the science
If fresh broth is added throughout, which phase might never appear, and why?
Explore a possible response
Stationary and death can be delayed or avoided because nutrients are replaced and wastes diluted, so the exponential phase can continue. That is no longer the simple closed curve.
Explore the source
- Microbiology Society: what is microbiologyMicrobiology Society
Lag phase is busy, even when the curve is flat
6A · The Growth of Bacterial ColoniesA study of Salmonella entering fresh medium found changes in gene expression soon after inoculation, before rapid population growth. The flat-looking lag phase is therefore not necessarily inactivity;…Specification 6.3Read & use the scienceClose article
Why this matters
A study of Salmonella entering fresh medium found changes in gene expression soon after inoculation, before rapid population growth. The flat-looking lag phase is therefore not necessarily inactivity; cells may be adjusting transport and metabolism to new conditions. In a food-safety laboratory, knowing the starting state matters when estimating when a culture will reach a dangerous density. The school curve records population number, not every process inside each bacterium. Exponential growth then permits a rate constant to be calculated from the rising section, but the same constant should not be applied blindly to the lag or stationary phases.
Back to the specification
Pearson Edexcel IAL Biology · Issue 2, February 2021 · Unit 4, pp. 29–32. The application extends beyond required recall.
- 6.3 understand the different phases of a bacterial growth curve (lag phase, exponential phase, stationary phase and death phase) and be able to calculate exponential growth rate constants
Use the science
Why would using the exponential-phase rate constant to extrapolate through the lag phase overestimate an early culture count?
Explore a possible response
The population is not yet multiplying at the exponential-phase rate during lag, even though individual cells may be metabolically active.
Explore the source
- Lag phase prepares bacteria for exponential growthProceedings of the National Academy of Sciences · Abstract