
What you need to know
- 7.15Core Practical 17: effects of exercise on tidal volumeThe volume of air breathed in or out in one breath., breathing rateThe number of breaths taken per minute., minute ventilationThe volume of air breathed in per minute: tidal volume × breathing rate. and oxygen consumption using spirometer traces.
The specification allows data from traces, so a live closed-circuit spirometer is not assumed. If a school uses one, soda lime is corrosive and the subject must be screened by the teacher. No breath-holding contests. Traces here are illustrative. Clinical spirometry is a different NHS test.
By the end, you should be able to…
- Measure tidal volume and rate from a labelled trace.
- Calculate minute ventilation and oxygen consumption with units.
- Compare rest and exercise without over-claiming from one person.
Build your understanding
Four measurements, one trace family
Aim: use spirometer traces to investigate the effect of exercise on tidal volumeThe volume of air breathed in or out in one breath., breathing rateThe number of breaths taken per minute., minute ventilationThe volume of air breathed in per minute: tidal volume × breathing rate. and oxygen consumption. Independent variable: rest versus exercise, or exercise intensity if several traces are given. Dependent variables: the four quantities. A fair comparison uses the same person, the same spirometer calibrationChecking or setting a measuring instrument against a known standard, such as finding what one eyepiece division is worth., and traces long enough to count several breaths.
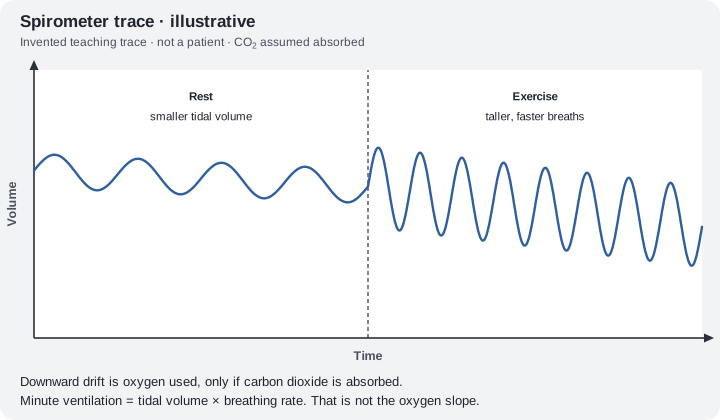
Tidal volume is the height of one ordinary wave, from trough to peak, converted with the scale. Breathing rate is the number of peaks per minute. Minute ventilation is the product. Oxygen consumption is the fall in volume per minute when the trace says carbon dioxide was absorbed. If the question does not say that, do not invent the slope.
A worked illustrative pair
Invented rest: tidal volume 0.45 dm³, 14 breaths per minute, so minute ventilation = 6.3 dm³/min. Oxygen slope = 280 cm³/min. Invented steady exercise: tidal volume 1.2 dm³, 28 breaths per minute, minute ventilation = 33.6 dm³/min. Oxygen slope = 1200 cm³/min. All four have increased. These numbers are not a class result and not a grade boundary.
Recovery traces often show rate and oxygen use falling gradually. A single breath immediately after exercise can be an outlier. Average several resting breaths. Do not claim a significant difference unless a question supplies a test and a critical value. Two traces are a comparison, not a populationAll the individuals of one species living in one area at the same time..
Safety if apparatus is real
Many centres meet 7.15 entirely with supplied traces. That avoids asking a student to rebreathe in a closed circuit. If apparatus is used, the teacher is responsible for medical screening, mouthpiece hygiene, and the corrosive carbon dioxide absorbent. Oxygen supply must not be improvised. A closed spirometer holds only a few cubic decimetres of oxygen, enough for a few minutes of exercise, which is why exercise traces are short. This page is not a protocol.
Do not confuse the trace with NHS spirometry, which measures a forced exhaled volume to check lung function. Report the four specification quantities, with units, and say what exercise did to them in the data you were given.
| Quantity | How it is read | Typical exercise change |
|---|---|---|
| Tidal volume | Height of one breath | Increases |
| Breathing rate | Breaths per minute | Increases |
| Minute ventilation | Tidal volume × rate | Increases |
| Oxygen consumption | Downward slope if CO₂ absorbed | Increases |
The spirometer trace lab
Read the scales, measure tidal volume trough to peak, count breaths in a time bracket and fit the oxygen slope on fictional closed-spirometer traces, then compare rest with exercise. The subject and every trace are fictional.
Simulation only, traces from a fictional subject. Real spirometers are used only under supervision with medical screening, a disinfected mouthpiece and fresh soda lime (corrosive dust). Stop if anyone feels dizzy. This is a method practical, not a health test.
Method 6 steps
- Read the calibration: the volume and the time represented by one large square.
- Measure tidal volume as the trough-to-peak height of at least three ordinary breaths and take the mean.
- Count the breaths in a known time (for example 60 s) to find the breathing rate in breaths min⁻¹.
- Calculate minute ventilation = tidal volume × breathing rate (dm³ min⁻¹).
- With CO₂ absorbed by soda lime, find the fall in volume over at least 30 s through matching points; oxygen consumption = fall ÷ time (cm³ min⁻¹).
- Repeat for the exercise trace from the same person and spirometer, then compare.
Aligned with the order of the specification practical. Simulation only: a teacher sets the real volumes, concentrations and risk controls; this is not a laboratory protocol.
Variables
- Independent
- Activity: rest versus steady exercise.
- Dependent
- Tidal volume, breathing rate, minute ventilation and oxygen consumption.
- Controlled
- Same person
- Same spirometer and calibration
- Same posture
- Rest recorded only after sitting quietly
- Several breaths averaged on each trace
Safety
- Real spirometers are used only under teacher supervision, with medical screening (for example, no one with asthma or a heart condition).
- Use a disinfected mouthpiece and fresh soda lime; soda lime is corrosive and its dust must not be inhaled.
- Stop at once if the subject feels dizzy or faint. A closed spirometer holds only a few minutes of oxygen at exercise rates.
Follow your school’s risk assessment; these notes are not a substitute for it.
Interpreting
- Fictional Subject A: rest 0.45 dm³ × 14 min⁻¹ = 6.3 dm³ min⁻¹, oxygen 280 cm³ min⁻¹; exercise 1.2 dm³ × 28 min⁻¹ = 33.6 dm³ min⁻¹, oxygen 1200 cm³ min⁻¹.
- Rate doubles, but tidal volume also rises, so minute ventilation rises about five-fold.
- The slope is oxygen consumption only because carbon dioxide is absorbed. With exhausted soda lime the trace barely falls.
- One subject’s traces show a change for that person; they are not evidence about a population or a diagnosis.
Guided method · step 1 of 10
- In 1 · Trace and scales, just below these steps, keep Trace on Rest and read the paper.
- Choose the volume for 1 large square (up) = and the time for 1 large square (across) =.
A millimetre on the paper is not a dm³ until you use the axis. Every number later depends on this calibration.
1 · Trace and scales
Subject A seated quietly for 10 minutes, then one deep breath at the start and ordinary breathing.
Pen
Tool
Follow the guided steps: start by reading the scales on the rest trace.
2 · Calculator
3 · Compare rest and exercise
4 · Unfair samples
Evaluate
Traces come from a simple generator: rest 0.45 dm³ × 14 min⁻¹ with 280 cm³ O₂ min⁻¹, steady exercise 1.2 dm³ × 28 min⁻¹ with 1200 cm³ min⁻¹, breath-to-breath variation of about 7%.
Make your reasoning visible
Scale before subtraction
A millimetre on the paper is not a dm³ until you use the axis.
Product, then slope
Do not report minute ventilationThe volume of air breathed in per minute: tidal volume × breathing rate. as the oxygen consumption.
Avoid this misconception
The claim: The tallest peak on the page is the vital capacity, so that is the tidal volumeThe volume of air breathed in or out in one breath..
The correction: Tidal volume is a normal breath. A maximum forced breath is a different volume and is closer to clinical spirometry than to this practical.
Check your understanding
Try each question before opening the suggested answer.
Check your understanding (continued)
Practice question
Retrieval and explanation · suggested answer
State the four quantities Core Practical 17 asks you to obtain from traces.
Show suggested answer
Tidal volume, breathing rate, respiratory minute ventilation and oxygen consumption.
Practice question
Retrieval and explanation · suggested answer
How do you calculate respiratory minute ventilation?
Show suggested answer
Tidal volume multiplied by breathing rate, with a volume-per-minute unit.
Practice question
Retrieval and explanation · suggested answer
Illustrative: 18 breaths in 30 seconds, tidal volume 1.0 dm³. Calculate rate and minute ventilation.
Show suggested answer
Rate = 36 per minute. Minute ventilation = 36 dm³ per minute. Invented.
Practice question
Retrieval and explanation · suggested answer
Why might a school use a printed trace instead of a live spirometer?
Show suggested answer
The specification allows data from traces. A closed-circuit spirometer has medical and chemical risks that a teacher must approve. Printed data still let you practise the four calculations.
Take the idea further
Apply the same specification knowledge to an unfamiliar problem. Any extra assumptions are supplied in the question.
Stretch question
A rest trace falls by 150 cm³ in 30 seconds with carbon dioxide absorbed. An exercise trace falls by 400 cm³ in 20 seconds. Calculate both oxygen consumptions in cm³ per minute. The exercise tidal volume is not printed. What can you not claim?
Show a hint
Convert each fall to a per-minute rate. Then look at what is missing.
Explore the reasoning
Rest: 150 × 2 = 300 cm³/min. Exercise: 400 × 3 = 1200 cm³/min. Oxygen consumption increased. You cannot calculate minute ventilation or tidal volume because those lengths are not given. You also cannot claim a population difference from one pair of traces. Numbers are illustrative.
Recall this lesson
Lesson recall questions
Question 1 of 5: List four measurements core practical 17 takes from spirometer traces.
Exercise and spirometer traces
Practice question
Retrieval and explanation · suggested answer
List four measurements core practical 17 takes from spirometer traces.
Lesson: CP17: Exercise and Respiratory Measurements
Try this from memory first.
Put your biology to work
Explore where these ideas appear in the world. Enrichment, not extra required recall.
Spirometer and spirometry are not automatic synonyms
CP17 · Exercise and Respiratory MeasurementsThe NHS uses spirometry for a clinic test of how much air a person can blow out. Your practical uses spirometer traces for ordinary breaths and oxygen use.…Specification 7.15Read & use the scienceClose article
Why this matters
The NHS uses spirometry for a clinic test of how much air a person can blow out. Your practical uses spirometer traces for ordinary breaths and oxygen use. The shared root is the enrichment warning: read which volumes the question named before you calculate. A clinician may use forced expiration to investigate obstruction, while an exercise physiologist asks how ordinary ventilation and oxygen consumption change as workload rises. Both use respiratory measurements but answer different questions. On a trace, tidal volume is the vertical difference for one ordinary breath and minute ventilation also needs the number of breaths per minute. A large forced breath is not the representative breath for that calculation.
Back to the specification
Pearson Edexcel IAL Biology · Issue 2, February 2021 · Unit 5, pp. 35–38 · assessed through Unit 6. The application extends beyond required recall.
- 7.15 Core Practical 17: use spirometer traces to investigate exercise effects on tidal volume, breathing rate, minute ventilation and oxygen consumption.
Use the science
A question asks for tidal volume. Why is a forced one-second blow the wrong measurement to copy from a clinic leaflet?
Explore a possible response
That blow is a lung-function test, not one resting or exercising breath. Tidal volume is the ordinary breath on the trace you were given.
Explore the source
The exercise mask asks a broader question
CP17 · Exercise and Respiratory MeasurementsNHLBI describes cardiopulmonary exercise testing as combining exercise workload with ECG, blood pressure and analysis of exhaled gases. An exercise physiologist can ask whether a limitation is mainly…Specification 7.15Read & use the scienceClose article
Why this matters
NHLBI describes cardiopulmonary exercise testing as combining exercise workload with ECG, blood pressure and analysis of exhaled gases. An exercise physiologist can ask whether a limitation is mainly cardiac, pulmonary or related to effort. Core Practical 17 uses a spirometer trace to calculate tidal volume, breathing rate, minute ventilation and oxygen consumption. Those trace quantities are part of the larger physiological story, but a school graph cannot diagnose a disease. An increase in breathing rate alone also does not tell you how much air moves per breath.
Back to the specification
Pearson Edexcel IAL Biology · Issue 2, February 2021 · Unit 5, pp. 35–38 · assessed through Unit 6. The application extends beyond required recall.
- 7.15 Core Practical 17: use spirometer traces to investigate exercise effects on tidal volume, breathing rate, minute ventilation and oxygen consumption.
Use the science
Two people have the same breathing rate after exercise. Why might their minute ventilations differ?
Explore a possible response
Minute ventilation is breathing rate multiplied by tidal volume. Equal rates can accompany different volumes per breath, so both must be measured from the trace.