
What you need to know
- 7.13(ii)Changes in ventilation and cardiac outputThe volume of blood pumped by one ventricle per minute: cardiac output = stroke volume × heart rate. speed oxygen delivery and carbon dioxide removal during exercise.
- 7.15tidal volumeThe volume of air breathed in or out in one breath., breathing rateThe number of breaths taken per minute., minute ventilationThe volume of air breathed in per minute: tidal volume × breathing rate. and oxygen consumption, as read from spirometer data. The practical method is Core Practical 17.
Clinical spirometry (how hard you can blow) is not this trace. Cardiac-output arithmetic is 7B 7. Illustrative volumes are not a fitness test. Do not run a breath-holding experiment from this page.
By the end, you should be able to…
- Define tidal volume, breathing rate and respiratory minute ventilation.
- Read oxygen consumption from a downward slope only when carbon dioxide is absorbed.
- Explain why both ventilation and cardiac output rise in exercise.
Build your understanding
Three ventilation numbers
tidal volumeThe volume of air breathed in or out in one breath. is the volume of air in one ordinary breath, in or out, not a forced maximum. breathing rateThe number of breaths taken per minute. is breaths per minute. minute ventilationThe volume of air breathed in per minute: tidal volume × breathing rate. is tidal volume × breathing rate. Illustrative rest: 0.5 dm³ × 12 breaths per minute = 6 dm³ per minute. Illustrative exercise: 1.5 dm³ × 24 = 36 dm³ per minute. Invented, for the arithmetic.
Minute ventilation is not oxygen consumption. Much of each breath fills airways that do not exchange gas. You are not required to calculate dead space unless a question gives it. You are required to calculate the product and to know that it rises in exercise because breaths get deeper, faster, or both.
Oxygen consumption is the slope
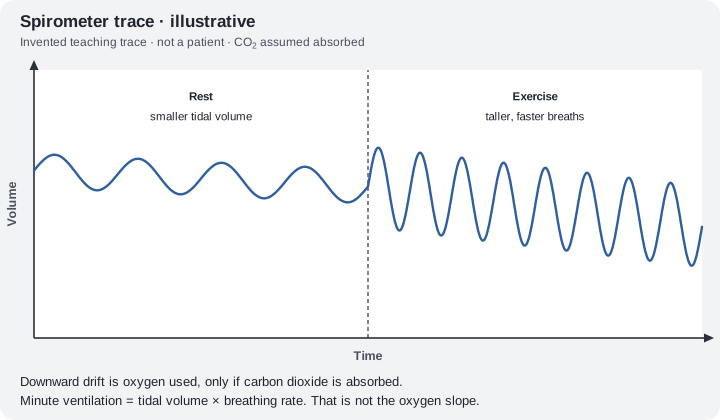
In a closed spirometer that absorbs carbon dioxide, the total volume of gas falls as oxygen is used. The gradient of that fall is oxygen consumption, for example cm³ per minute. A steeper downward slope during exercise means a higher rate of oxygen use, which matches a higher rate of aerobic respirationRespiration using oxygen: glycolysis, the link reaction, the Krebs cycle and oxidative phosphorylation. It releases much more ATP than anaerobic respiration. in working muscle.
If carbon dioxide is not absorbed, the trace will not show a simple oxygen slope, because carbon dioxide is being added as oxygen is removed. Read the method before you treat a wiggle as a rate. A clinical blow-as-hard-as-you-can test is a different measurement and is not this slope.
Why both pumps speed up
Working muscle uses oxygen faster and produces carbon dioxide faster. A higher minute ventilation keeps the concentration gradients at the alveoli. A higher cardiac outputThe volume of blood pumped by one ventricle per minute: cardiac output = stroke volume × heart rate., from 7B 7, moves the blood between lungs and muscle more quickly. Together they deliver oxygen and remove carbon dioxide fast enough for aerobic ATPAdenosine triphosphate: the molecule that releases energy for cell processes when it is hydrolysed to ADP and Pi. supply to rise.
There is a lag at the start of exercise, and a recovery period after it, while oxygen use remains above the resting level. lactateThe product of anaerobic respiration in animals, formed when pyruvate is reduced by reduced NAD. processing from 7A is part of that recovery story. Do not claim that ventilation and heart rateThe number of heartbeats per minute. return to rest in the same second the movement stops.
Make your reasoning visible
Multiply, and name it
tidal volumeThe volume of air breathed in or out in one breath. × rate = minute ventilationThe volume of air breathed in per minute: tidal volume × breathing rate.. Include dm³ min⁻¹ or the unit you were given.
Slope needs the absorber
Say “oxygen consumption” only if carbon dioxide was removed or the question tells you the slope is oxygen.
Avoid this misconception
The claim: Minute ventilation is the oxygen the body used, and a spirometer trace is the same test as clinical spirometry.
The correction: Minute ventilation is the air moved per minute. Oxygen consumption is the oxygen actually used. Clinical spirometry measures a forced blow, which is a different NHS test from these exercise traces.
What does a spirometer trace tell you about exercise?
Each wave is a breath. Its height is the tidal volume, the number per minute is the breathing rate, and their product is minute ventilation. With CO₂ absorbed, the downward slope is oxygen consumption.
What the model shows
A constructed trace at rest, during a run and in recovery, with and without soda lime.
What to look for
The breath height and spacing, the steepness of the slope, and how much each value rises compared with rest.
What it tells us
Minute ventilation = tidal volume × rate. The slope only shows oxygen use when CO₂ is absorbed. Breathing and oxygen use stay above rest during recovery.
Be careful what you claim
Constructed, illustrative traces.
Try it in the model: press Play and watch the breaths get deeper and faster when the run starts.
Ventilation in exercise
Read a constructed spirometer trace through rest, exercise and recovery: tidal volume, breathing rate, minute ventilation and the oxygen slope. All values are illustrative.
What you see
- A closed spirometer trace for the last minute, with soda lime absorbing CO₂ unless you remove it. One breath and the oxygen slope are marked.
- Tidal volume, breathing rate, minute ventilation and oxygen consumption, and a graph of how many times their resting value each has reached.
How to use it
- Choose the activity and the CO₂ absorber, then play or drag Time.
What it shows
- Tidal volume, breathing rate, respiratory minute ventilation and oxygen consumption from a spirometer trace (7.15).
- Why ventilation and cardiac output both rise in exercise, with a lag at the start and a recovery period after (7.13).
Limits of the model
- Constructed traces with illustrative values, not a recording or a fitness test. Clinical spirometry (a forced blow) is a different measurement.
- The method for the practical is Core Practical 17. Do not run a breath-holding experiment from this page.
Guided tour · step 1 of 9
In Session, just below these steps, press Play and pause before minute 2 (or drag Time to 1.5).
Each wave is one breath. Its height is the tidal volume (0.5 dm³) and there are 12 per minute. Minute ventilation = 0.5 × 12 = 6 dm³ min⁻¹. With CO₂ absorbed, the trace drifts down by the oxygen used.
Session
Questions
Check your understanding
Try each question before opening the suggested answer.
Check your understanding (continued)
Practice question
Retrieval and explanation · suggested answer
Define tidal volume.
Show suggested answer
The volume of air breathed in or out in one normal breath.
Practice question
Retrieval and explanation · suggested answer
Calculate respiratory minute ventilation if tidal volume is 0.4 dm³ and rate is 15 breaths per minute.
Show suggested answer
0.4 × 15 = 6 dm³ per minute.
Practice question
Retrieval and explanation · suggested answer
How is oxygen consumption read from a spirometer trace that absorbs carbon dioxide?
Show suggested answer
From the downward gradient: the volume of oxygen removed per unit time.
Practice question
Retrieval and explanation · suggested answer
Why do ventilation and cardiac output both increase in exercise?
Show suggested answer
Muscle uses more oxygen and produces more carbon dioxide. Higher ventilation maintains gas exchange; higher cardiac output delivers and removes the gases faster.
Take the idea further
Apply the same specification knowledge to an unfamiliar problem. Any extra assumptions are supplied in the question.
Stretch question
Illustrative trace: at rest, tidal volume 0.5 dm³, 10 breaths per minute, oxygen slope 250 cm³ per minute. In exercise, tidal volume 2.0 dm³, 20 breaths per minute, oxygen slope 1500 cm³ per minute. Calculate both minute ventilations. Has oxygen consumption increased by the same factor as minute ventilation?
Show a hint
Two separate calculations. Then compare ratios.
Explore the reasoning
Rest minute ventilation = 5 dm³/min. Exercise = 40 dm³/min, an 8-fold rise. Oxygen consumption rose from 250 to 1500 cm³/min, a 6-fold rise. They do not have to match: minute ventilation includes air that does not all exchange, and the numbers are invented. The direction of both changes is what exercise requires.
Recall this lesson
Lesson recall questions
Question 1 of 5: State the equation for cardiac output.
Cardiac output and ventilation control
Practice question
Retrieval and explanation · suggested answer
State the equation for cardiac output.
Lesson: 7B 7: Controlling the Heart and Breathing Rates
Try this from memory first.
Put your biology to work
Explore where these ideas appear in the world. Enrichment, not extra required recall.
Spirometry on the NHS is not this trace
7B · The Response of the Breathing System to ExerciseThe NHS describes spirometry as a test of how much air you can breathe out, used to check lung function. That is a forced clinical measurement. Core Practical…Specification 7.15Read & use the scienceClose article
Why this matters
The NHS describes spirometry as a test of how much air you can breathe out, used to check lung function. That is a forced clinical measurement. Core Practical data in this course are about tidal breathing, minute ventilation and oxygen consumption from a trace. Do not copy FEV numbers into a tidal-volume answer. The existence of the clinical test is only a warning about the name. 7.13 and 7.15: ventilation changes in exercise, read as tidal volume, rate, minute ventilation and oxygen consumption.
Back to the specification
Pearson Edexcel IAL Biology · Issue 2, February 2021 · Unit 5, pp. 35–38. The application extends beyond required recall.
- 7.15 Exercise and spirometer measurements of ventilation and oxygen use.
Use the science
Why does “the NHS spirometry result is the oxygen slope” fail?
Explore a possible response
That test measures a forced blow to assess lung function. The oxygen slope comes from a trace where carbon dioxide is absorbed and the volume falls as oxygen is used. Different method, different number.
Explore the source
The exercise mask measures more than a breath count
7B · The Response of the Breathing System to ExerciseA cardiopulmonary exercise laboratory can combine an ECG, blood pressure and exhaled-gas analysis while a person exercises. NHLBI describes this as a way to assess heart and lung…Specification 7.15Read & use the scienceClose article
Why this matters
A cardiopulmonary exercise laboratory can combine an ECG, blood pressure and exhaled-gas analysis while a person exercises. NHLBI describes this as a way to assess heart and lung function together. A school spirometer trace in 7.15 gives tidal volume, breathing rate and minute ventilation; gas analysis adds another measurement of oxygen use. More equipment does not make every inference automatic: a low oxygen uptake might arise from several limitations, and the clinical test needs trained interpretation. The useful school habit is to name what was actually measured before calculating a rate or explaining a change.
Back to the specification
Pearson Edexcel IAL Biology · Issue 2, February 2021 · Unit 5, pp. 35–38. The application extends beyond required recall.
- 7.15 Exercise and spirometer measurements of ventilation and oxygen use.
Use the science
A spirometer trace gives tidal volume and breathing frequency. What can you calculate, and what would require an additional gas measurement?
Explore a possible response
You can calculate respiratory minute ventilation by multiplying tidal volume by breathing frequency. Oxygen consumption needs information about the oxygen in inhaled and exhaled gas, not just volume.
Explore the source
- Pulmonary function testsUS National Heart, Lung, and Blood Institute