
What you need to know
- 5.14Core Practical 11: ecology of a habitatThe place where an organism lives. using quadratA square frame of known area used to sample organisms. and transectA line across a habitat along which samples are taken, to show how organisms change with conditions., plus appropriate abioticNon-living. Abiotic factors include light, temperature, water and soil pH. factors.
Preparation for supervised fieldwork. Follow the school’s sites, permissions, tides and livestock rules. Do not remove rare plants or record personal addresses. Fictional counts are teaching data.
By the end, you should be able to…
- Write a question that matches random quadrats or a transect.
- Pair biological records with abiotic readings.
- Evaluate sample size, bias, identification and weather.
Build your understanding
Plan the comparison
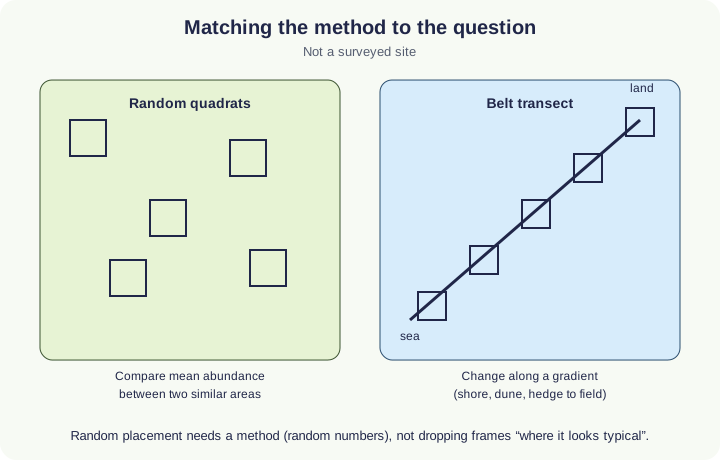
Write one question. Example: does mean percentage coverThe percentage of the area of a quadrat covered by one species. of speciesA group of organisms that can interbreed to produce fertile offspring. X differ between grazed and ungrazed grassland? Then random quadratA square frame of known area used to sample organisms. in each area, same frame size, same day. Example: how does species cover change with height up a rocky shore? Then a belt transectA line across a habitat along which samples are taken, to show how organisms change with conditions. down the gradient, several frames at each station, and a height or distance record.
Independent variable: the site, the distance along the transect, or the abioticNon-living. Abiotic factors include light, temperature, water and soil pH. factor you set out to test. Dependent variable: density, frequency or percentage cover of named species. Controls: frame size, time of year, observer, identification key, and which abiotic meter you use.
In the habitat
Use random numbers to place frames unless you are on a planned transect. Identify species with the key you were given; if unsure, record “unknown 1” and a photo if allowed — do not guess a Latin name. Record abiotic factors that fit the question: light, temperature, soil moisture, pHA measure of how acidic or alkaline a solution is, based on its H⁺ ion concentration. Below 7 is acidic, above 7 is alkaline., salinity, slope, wind. Take the reading at the quadrat, not back at the bus.
Risks: tides and waves, slippery rock, livestock, pollen, ticks, steep slopes, roads, and getting cold. Work in the approved group, carry the listed kit, and leave the site as you found it. Do not collect protected plants. This guide does not replace a teacher’s risk assessment.
Evaluate before you celebrate
Small n, one day, one observer, misidentified seedlings, a sudden shower, and frames that bounced off tussocks all add uncertainty. Mobile animals are under-sampled by plant frames. A fictional set of five covers such as 4, 6, 40, 5, 7% is a warning about outliers and why a mean without spread misleads — those numbers are not yours to copy as data.
Process with the test that matches the design (5B 7). State whether the result is significant against the given critical value, then give a biological mechanism and a limitation. correlationA relationship in which two variables change together. A correlation does not prove that one causes the other. along a transect is not proof that the measured factor is the only cause of zonation.
The woodland edge fieldwork lab
Lay a belt transect from woodland into meadow, or compare the two with random quadrats. Count the plants and estimate grass cover yourself, read light, soil moisture, temperature and pH in each quadrat, then test the pattern with Spearman’s rank or a t-test. A teaching model: the site, plants and every reading are fictional.
Simulation only. On real fieldwork: work in pairs and tell someone where you are, wear suitable footwear, watch for uneven ground, nettles and livestock, disturb the habitat as little as possible, and wash your hands after handling soil.
Method 8 steps
- Decide the question. For a change across a boundary (wood to meadow, up a shore), use a belt transect; to compare two areas, use random quadrats.
- Transect: lay a tape at right angles to the boundary, from one habitat into the other.
- Choose one frame size (for example 1 m × 1 m with a 10 × 10 grid) and a regular interval, and keep both the same throughout.
- At each station, count individuals of each species you can count (density = number ÷ frame area) and estimate percentage cover for mat-forming plants such as grass.
- At the same station, measure abiotic factors: light intensity, soil moisture, soil temperature and pH.
- Repeat along parallel tapes, and work out the mean at each distance.
- Random quadrats: generate coordinates from random numbers inside each area, place the frame at each and record as above.
- Analyse: kite diagram and Spearman’s rank for a transect; means and an unpaired t-test for two areas.
Aligned with the order of the specification practical. Simulation only: a teacher sets the real volumes, concentrations and risk controls; this is not a laboratory protocol.
Variables
- Independent
- Distance along the transect (with the abiotic factors that change along it), or the area sampled (wood or meadow).
- Dependent
- Density of each species (plants per m²), percentage cover of grass, and frequency.
- Controlled
- Same frame size and grid for every quadrat
- Same sampling interval along every tape
- Light read at the same time as a reference, or as % of the open meadow, because clouds change it
- Same person and the same rule for “at least half covered” when estimating cover
- Same day and similar weather for all stations
Safety
- Tell someone where you are going and when you will be back; work in pairs.
- Wear suitable footwear and clothing; watch for uneven ground, brambles, nettles and livestock.
- Wash hands after handling soil and plants, and before eating.
- Disturb the habitat as little as possible and do not uproot plants.
- Simulation only: the light, moisture, temperature and pH values are fictional.
Follow your school’s risk assessment; these notes are not a substitute for it.
Interpreting
- Kite width shows mean density at each distance, so you can see where each species peaks.
- Spearman’s rₛ runs from −1 to +1. Compare |rₛ| with the critical value for your number of stations (two-tailed, p = 0.05; n = 5 needs 1.000).
- With the t-test, compare |t| with the critical value at n₁ + n₂ − 2 degrees of freedom.
- A significant result shows an association, not a cause: light, moisture, temperature and pH all change together across the edge.
Guided method · step 1 of 10
- In 1 · Plan, just below these steps, choose a Question.
- Choose the Sampling design that answers it: Belt transect for a change across the woodland edge, Random quadrats to compare two areas.
A transect samples systematically along a gradient. Random quadrats avoid bias when you compare two areas that are each fairly uniform.
1 · Plan
6 stations at this interval. Keep one frame size and interval for the whole survey.
Follow the guided steps: start by choosing a question.
2 · This quadrat
Do one quadrat by hand first; then auto-record unlocks. Density = count ÷ frame area. Cover: each small square at least half grass counts as 1 %.
Progress
3 · Analyse
rₛ = 1 − 6Σd² ÷ n(n² − 1), on the station means of all tapes. Tied values share a rank, so rₛ here is calculated exactly on the ranks. Critical values are two-tailed at p = 0.05 (n = 5 needs 1.000; above 30 stations, 1.96 ÷ √(n − 1)).
Evaluate: exam check
The site, plant tolerances, lux, moisture, temperature and pH values are fictional teaching values from a simplified model. Light meters really do drift with cloud; that is why paired or relative readings help.
Make your reasoning visible
Same frame, same skill
Choose one frame size before you start and keep it: a bigger frame catches more plants, so changing quadratA square frame of known area used to sample organisms. size mid-comparison wrecks the means. Still report density per m², so other surveys can compare with yours.
Abiotic at the point of the biology
A single weather-station reading for the whole hill is not “measured at the quadrat”.
Avoid this misconception
The claim: More quadrats are always better, so fifty frames along the path we already walk will do.
The correction: A large biased sample is still biased. Random or properly spaced transectA line across a habitat along which samples are taken, to show how organisms change with conditions. stations beat a huge convenience sample.
Check your understanding
Try each question before opening the suggested answer.
Check your understanding (continued)
Practice question
Retrieval and explanation · suggested answer
State independent and dependent variables for a grazed versus ungrazed cover study.
Show suggested answer
Independent: grazing treatment (or site type). Dependent: percentage cover (or density/frequency) of the named species.
Practice question
Retrieval and explanation · suggested answer
Give two reasons a shore transect should record abiotic factors at each station.
Show suggested answer
First, factors such as height, emersion time or rock temperature change along the shore and may explain the zonation, so you need them to suggest a mechanism. Second, measuring them at the same station as the cover gives paired data, so you can test the association statistically (for example with Spearman’s rank) rather than guess.
Practice question
Retrieval and explanation · suggested answer
Why is dropping quadrats “in typical vegetation” not random?
Show suggested answer
The observer chooses patches that look right, so unusual or bare areas are under-sampled and means are biased.
Practice question
Retrieval and explanation · suggested answer
List two risks of rocky-shore work and a control for each.
Show suggested answer
Incoming tide — check times and leave a margin. Slips on weed — suitable footwear and no running. (Other valid pairs: waves, isolation, hypothermia.)
Take the idea further
Apply the same specification knowledge to an unfamiliar problem. Any extra assumptions are supplied in the question.
Stretch question
You have ten random quadrats in a meadow and a significant t-test versus a second meadow. A parent says the class has “proved fertiliser caused the difference”. Identify two missing pieces.
Show a hint
Design versus mechanism.
Explore the reasoning
First, there was no designed treatment: fertiliser was not applied at random to replicate plots alongside unfertilised controls, so the t-test only shows that the two existing fields differ. Second, other differences between the fields (soil, drainage, grazing, seed mix) are confounded with fertiliser, so any of them could explain the result. A causal fertiliser claim needs a designed experiment, not only two existing fields.
Recall this lesson
Lesson recall questions
Question 1 of 5: Compare random quadrat sampling with a belt transect as ways of studying a habitat.
Quadrat and transect study
Practice question
Retrieval and explanation · suggested answer
Compare random quadrat sampling with a belt transect as ways of studying a habitat.
Lesson: 5B 6: Investigating Abundance and Distribution of Organisms
Try this from memory first.
Put your biology to work
Explore where these ideas appear in the world. Enrichment, not extra required recall.
Interrupted belts
CP11 · The Ecology of a HabitatFSC transect guidance notes that a long continuous belt can be impractical, and that several quadrats at each station along an interrupted belt give a better local picture.…Specification 5.14Read & use the scienceClose article
Why this matters
FSC transect guidance notes that a long continuous belt can be impractical, and that several quadrats at each station along an interrupted belt give a better local picture. That is evaluation of method, which 5.14 expects. Copy the idea, not someone else’s station list. Field ecologists have to decide whether a regular transect represents a habitat or merely misses small patches. Several quadrats at each station estimate local variation; they do not turn deliberately chosen stations into a random sample. Record where the belt runs and why. A later team cannot test your interpretation if your positions, quadrat dimensions and sampling rule have vanished from the notebook.
Back to the specification
Pearson Edexcel IAL Biology · Issue 2, February 2021 · Unit 4, pp. 29–32 · assessed through Unit 6. The application extends beyond required recall.
- 5.14 Core Practical 11: study a habitat with quadrats and transects to determine distribution and abundance and measure suitable abiotic factors.
Use the science
Why might stations every 30 m miss a narrow wet flush?
Explore a possible response
A narrow habitat patch can fall between stations. You would note it qualitatively or add a targeted extra station, and say that the regular spacing under-sampled that microhabitat.
Explore the source
- Field Studies Council: transectsField Studies Council
The countryside is sampled, not counted plant by plant
CP11 · The Ecology of a HabitatThe UK Centre for Ecology & Hydrology surveys vegetation and soils in selected one-kilometre squares, recording plants in several quadrats within each square. Field teams repeat the survey…Specification 5.14Read & use the scienceClose article
Why this matters
The UK Centre for Ecology & Hydrology surveys vegetation and soils in selected one-kilometre squares, recording plants in several quadrats within each square. Field teams repeat the survey over years to detect changes in habitats. That is Core Practical 11 at a much larger scale: quadrat area, placement and repeated sampling determine what the counts can represent. The national programme uses a stratified design, so its estimates require attention to which landscape types were sampled. One interesting patch, however carefully counted, cannot stand for every habitat in a country.
Back to the specification
Pearson Edexcel IAL Biology · Issue 2, February 2021 · Unit 4, pp. 29–32 · assessed through Unit 6. The application extends beyond required recall.
- 5.14 Core Practical 11: study a habitat with quadrats and transects to determine distribution and abundance and measure suitable abiotic factors.
Use the science
Why would five quadrats placed beside the prettiest flowers give a poor estimate of the whole square?
Explore a possible response
The placements are biased toward flower-rich patches. A defined sampling design spreads quadrats across the target area or its habitat strata, so the estimate is not driven by the observer’s preference.
Explore the source
- UK-SCAPE Countryside SurveyUK Centre for Ecology & Hydrology