
What you need to know
- 5.14Study a habitatThe place where an organism lives. using quadratA square frame of known area used to sample organisms. and transectA line across a habitat along which samples are taken, to show how organisms change with conditions. for distribution and abundance, and measure appropriate abioticNon-living. Abiotic factors include light, temperature, water and soil pH. factors. Core Practical 11 is the full method page.
This lesson is the design language. The supervised field protocol, risks and evaluation live on the CP11 page. Statistics are 5B 7. Do not collect personal location data or remove protected species.
By the end, you should be able to…
- Choose random quadrats versus a transect to match the question.
- Define density, frequency and percentage coverThe percentage of the area of a quadrat covered by one species..
- Name abiotic measurements that belong with the biological data.
Build your understanding
Ask a question first
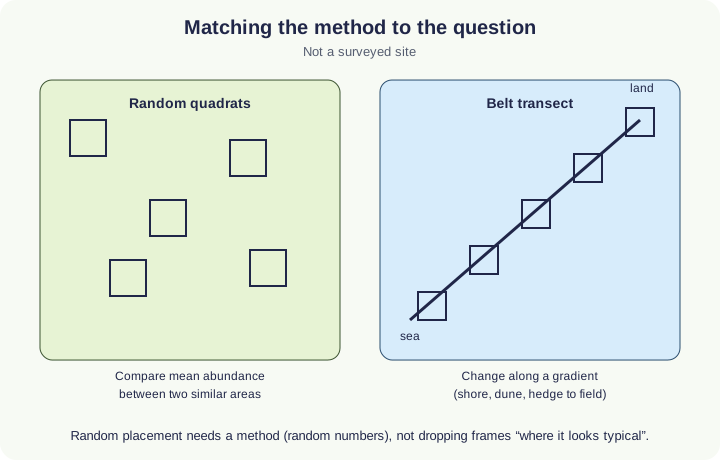
If you want the mean abundance of a speciesA group of organisms that can interbreed to produce fertile offspring. in two similar fields, use randomly placed quadratA square frame of known area used to sample organisms. in each area so every point has a known chance of selection. Random numbers, a grid and coordinates beat dropping frames “where it looks typical” — that is biased sampling, not a method.
If you want how species change along a gradient — down a shore, across a dune, from hedge to field — use a transectA line across a habitat along which samples are taken, to show how organisms change with conditions.. A line transect records what touches the tape. A belt transect places quadrats along the line, often at regular intervals (interrupted) or continuously. Regular intervals on a gradient are systematic, which is appropriate here; they are not a substitute for random samples when you are estimating a mean for a whole field.
What you record
Density is counts per unit area. Frequency is the percentage of quadrats (or points) in which the species occurs. percentage coverThe percentage of the area of a quadrat covered by one species. is the fraction of the frame occupied, useful for plants that are hard to count as individuals. Say which measure you used; they answer slightly different questions. ACFOR (abundant to rare) is a qualitative scale — fine for a sketch, weak for a statistical test.
Animals that move need a defined time, net, or trap protocol, or you record sessile and slow species only. Do not chase highly mobile birds with a 0.25 m² frame and call it density of the habitatThe place where an organism lives..
Abiotic data belong in the same notebook
Specification 5.14 expects abioticNon-living. Abiotic factors include light, temperature, water and soil pH. factors appropriate to the habitat: light meter, thermometer, soil moisture, pHA measure of how acidic or alkaline a solution is, based on its H⁺ ion concentration. Below 7 is acidic, above 7 is alkaline., salinity, wind, slope, or dissolved oxygen. Measure at the same stations as the quadrats so you can later test association. Calibrate or zero meters as instructed; one unrepeated reading is a snapshot.
Risks, sample size and evaluation are in Core Practical 11. This page is so you can choose the design before you stand in the mud.
| Aim | Layout | Why |
|---|---|---|
| Mean cover in two meadows | Random quadrats in each | Unbiased estimate of each area |
| Zonation down a shore | Belt transect down the gradient | Shows change with distance / height |
| Association with one abiotic factor | Paired biological + abiotic readings at stations | Supplies data for a correlation test |
Make your reasoning visible
Random is a procedure
Write how coordinates were generated. “We walked about” is not random.
Name the abundance measure
Cover, frequency and density are not interchangeable in a conclusion.
Avoid this misconception
The claim: A transectA line across a habitat along which samples are taken, to show how organisms change with conditions. is always better because it looks more scientific.
The correction: A transect is for a gradient. Random quadratA square frame of known area used to sample organisms. are better for comparing two areas that are not arranged along a line.
Check your understanding
Try each question before opening the suggested answer.
Practice question
Retrieval and explanation · suggested answer
When would you use a belt transect rather than random quadrats?
Show suggested answer
When investigating change in distribution and abundance along an environmental gradient, such as up a shore or across a dune.
Practice question
Retrieval and explanation · suggested answer
Distinguish frequency from percentage cover.
Show suggested answer
Frequency is how often a species occurs in samples (presence). Percentage cover is how much of each frame it occupies. A rare but large plant can have low frequency and high cover in the frames it hits.
Practice question
Retrieval and explanation · suggested answer
Why measure soil moisture at each quadrat rather than once for the whole wood?
Show suggested answer
Moisture can vary over metres. Pairing each biological sample with its own abiotic reading lets you test whether distribution tracks that factor.
Take the idea further
Apply the same specification knowledge to an unfamiliar problem. Any extra assumptions are supplied in the question.
Stretch question
A student places ten quadrats only in flower-rich patches “to make sure we find species”. Name the bias and the conclusion they can no longer trust.
Show a hint
Typicality is not a sampling method.
Explore the reasoning
It is subjective, biased sampling towards high-diversity patches. Mean abundance and “how common is this species in the habitat” are not trustworthy; the sample over-represents the colourful bits. A species list of what occurs at all might still be useful if labelled as non-random.
Recall this lesson
Lesson recall questions
Question 1 of 5: Compare random quadrat sampling with a belt transect as ways of studying a habitat.
Quadrat and transect study
Practice question
Retrieval and explanation · suggested answer
Compare random quadrat sampling with a belt transect as ways of studying a habitat.
Lesson: 5B 6: Investigating Abundance and Distribution of Organisms
Try this from memory first.
Put your biology to work
Explore where these ideas appear in the world. Enrichment, not extra required recall.
Why textbooks still talk about frames
5B · Investigating Abundance and Distribution of OrganismsThe Field Studies Council describes frame and point quadrats, frequency, and transects along gradients, including interrupted belt transects with several frames at each station. Those are professional versions…Specification 5.14Read & use the scienceClose article
Why this matters
The Field Studies Council describes frame and point quadrats, frequency, and transects along gradients, including interrupted belt transects with several frames at each station. Those are professional versions of 5.14. Their examples are teaching methods, not results you should copy into a lab book as if you had measured them. Choosing a frame size changes which plants are likely to be counted. Small quadrats can miss uncommon large plants; very large ones may be impractical to replicate. Method choice is therefore part of the evidence.
Back to the specification
Pearson Edexcel IAL Biology · Issue 2, February 2021 · Unit 4, pp. 29–32. The application extends beyond required recall.
- 5.14 CORE PRACTICAL 11: carry out a study of the ecology of a habitat, such as using quadrats and transects to determine the distribution and abundance of organisms, and measuring abiotic factors appropriate to the habitat
Use the science
Why might one quadrat at each transect station be too thin a sample?
Explore a possible response
A single frame is one point on a noisy gradient. Several frames at a station give a better local mean before you compare stations.
Explore the source
- Field Studies Council: vegetation samplingField Studies Council
A quadrat size can change the answer
5B · Investigating Abundance and Distribution of OrganismsUS Geological Survey ecologists compared quadrat sizes and transects for long-term monitoring of streamside vegetation. Very small frames missed useful frequencies for many species, while large frames and…Specification 5.14Read & use the scienceClose article
Why this matters
US Geological Survey ecologists compared quadrat sizes and transects for long-term monitoring of streamside vegetation. Very small frames missed useful frequencies for many species, while large frames and repeated transects captured different parts of the community. In school, choosing a quadrat is often presented as a routine step. In research it is a design decision tied to plant size, rarity and the question being asked. A quadrat that counts grasses well may be poor for sparse shrubs. More measurements do not remove a bias introduced by always placing frames in the easiest patch to reach.
Back to the specification
Pearson Edexcel IAL Biology · Issue 2, February 2021 · Unit 4, pp. 29–32. The application extends beyond required recall.
- 5.14 CORE PRACTICAL 11: carry out a study of the ecology of a habitat, such as using quadrats and transects to determine the distribution and abundance of organisms, and measuring abiotic factors appropriate to the habitat
Use the science
Why might doubling the number of tiny quadrats still fail to estimate the abundance of scattered shrubs?
Explore a possible response
The frame size may systematically miss shrubs; more of the same biased measurement does not fix the sampling scale.
Explore the source
- Field evaluations of riparian sampling techniquesUS Geological Survey