
What you need to know
- 5.10Calculate the efficiency of biomassThe mass of living material, often measured as dry mass per unit area. and energy transfers between trophic levelA feeding level in a food chain, such as producers or primary consumers..
GPP and NPP definitions and NPP = GPP − R are 5C 2. Food-web drawing from 5B is assumed, not retaught. Do not import A-level consumer equations that are not in this specification.
By the end, you should be able to…
- Calculate percentage efficiency of a transfer from given kJ or biomass values.
- Explain why energy and biomass are lost between trophic levels.
- Use NPP, not GPP, as the producerAn organism, usually a plant, that makes its own organic molecules by photosynthesis. Producers form the first trophic level. store available to primary consumerAn organism that gets its energy by eating other organisms..
Build your understanding
What you are dividing
A trophic levelA feeding level in a food chain, such as producers or primary consumers. is a feeding position: producerAn organism, usually a plant, that makes its own organic molecules by photosynthesis. Producers form the first trophic level., then primary consumerAn organism that gets its energy by eating other organisms., then secondary consumers. Efficiency of transfer = (energy or biomassThe mass of living material, often measured as dry mass per unit area. moving into the next trophic level ÷ energy or biomass in the previous trophic level) × 100. Keep the units the same and the time interval the same. Do not divide by GPP if the question gives NPP as the producer figure — primary consumers eat biomass that is left after plant respirationThe breakdown of respiratory substrates such as glucose in cells to release energy, which is used to make ATP..
A fictional woodland might store 18 500 kJ m⁻² year⁻¹ as NPP and pass 2 220 kJ m⁻² year⁻¹ into herbivores. Efficiency = (2 220 / 18 500) × 100 = 12.0% to three significant figures. The 10% “rule of thumb” is a memory aid, not a law. Calculate.
Where the rest goes
Not all producer tissue is eaten. Of what is eaten, some is indigestible and leaves as faeces (egestion). Some nitrogenous waste is excreted. A large fraction is used in respiration, so energy is transferred to the surroundings as heat and is not stored as new consumer biomass. Death and uneaten parts can still feed decomposers; that pathway is not “up” the grazing food chain you were asked about.
Biomass transfers use the same logic: dry mass added at one level is less than dry mass at the level below. Fresh mass misleads if water content differs. Energy pyramids are always the right way up if the units are energy per area per time; number pyramids can invert, but that is not 5.10.
Do not invent extra equations
This specification asks you to calculate transfers between trophic levels. It does not require a separate formula for a mammal’s net production from ingestion, faeces, urine and respiration. If a table gives you those extra columns, you can still find “energy in consumer biomass” and divide by the level below — stay with the given numbers.
Human harvesting is a transfer too. Taking grain rather than meat shortens the chain, so a larger share of NPP can end up in food. That is an application, not a new specification statement.
Follow the process
Identify the energy or biomass in the previous trophic level and in the next → use the same units and the same time interval → if consumers are eating producer biomass and you were given GPP, subtract plant respiration first to get NPP → efficiency = (amount in the next level ÷ amount in the previous level) × 100. The missing percentage is transferred elsewhere, not destroyed: not eaten, egested, excreted, or respired as heat. About 10% is a memory aid, not a law. Calculate the numbers you are given.
| Loss | What happens to the energy | Why it never arrives as next-level biomass |
|---|---|---|
| Not consumed | Stays in uneaten tissue, then often decomposers | Herbivores did not ingest it |
| Egestion | Faeces | Never absorbed |
| Respiration | Transferred as heat | Used by that organism, not stored |
| Excretion | Urine or equivalent | Absorbed then removed, not built into new tissue |
Make your reasoning visible
Build the explanation
X happens because Y, leading to Z. X: only a small percentage of one trophic levelA feeding level in a food chain, such as producers or primary consumers. becomes biomassThe mass of living material, often measured as dry mass per unit area. in the next. Y: much of the energy is respired as heat, and some tissue is never eaten or absorbed. Z: food chains stay short. Incomplete: “Energy is destroyed, so efficiency is always 10%.” Improved: “Efficiency = (2 220 / 18 500) × 100 = 12%, because respirationThe breakdown of respiratory substrates such as glucose in cells to release energy, which is used to make ATP., egestion and uneaten tissue mean most of the previous level never becomes new consumerAn organism that gets its energy by eating other organisms. biomass.” Use the numbers in the question.
Show the division
Write (energy in next level / energy in previous level) × 100 with units cancelled.
Name a mechanism for the missing percentage
“Energy is lost” is weaker than “respiration transfers energy as heat”.
Avoid this misconception
The claim: About 10% of energy is destroyed at each level.
The correction: Energy is transferred, not destroyed. Most does not remain as biomass in the next trophic level.
Why are there so few sparrowhawks in a wood full of caterpillars?
Each trophic level stores only a small fraction of the energy in the level below. The rest is not eaten, is egested or excreted, or is respired and lost as heat.
What the model shows
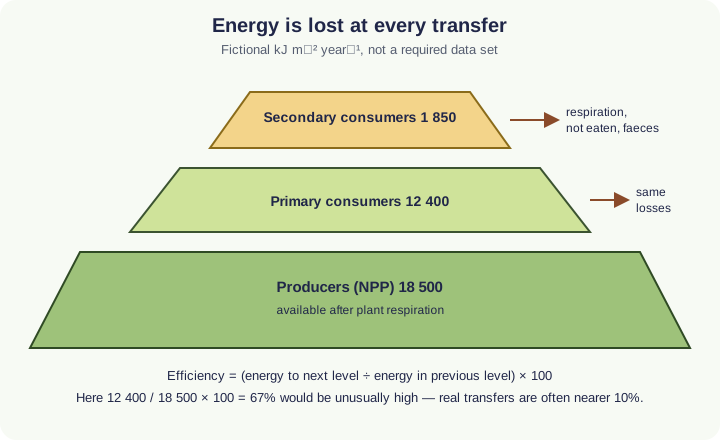
A fictional food chain with the energy in each level, where each level’s energy goes, and the efficiency of each transfer.
What to look for
The denominator in each calculation, the biggest loss at each step, and how little reaches the top.
What it tells us
Efficiency = (energy in next level ÷ energy in previous level) × 100, for example (2 220 ÷ 18 500) × 100 = 12.0%. Use NPP, not GPP, for producers.
Be careful what you claim
Fictional chains and numbers. “About 10%” is a rough guide, not a law.
Try it in the model: set Divide producers by to GPP and see why the answer is wrong.
Energy transfer between trophic levels
Follow the energy in a fictional food chain level by level, see where each level’s energy goes, and calculate the efficiency of each transfer.
What you see
- Transfers: a food chain with the energy stored in each trophic level, then two bars showing where one level’s energy goes: not eaten, egested, excreted, respired as heat or stored in the next level. The graph is a pyramid of energy.
- NPP: a producer in the month you choose, with GPP arriving as light and R leaving as heat, an annual bar of GPP split into R and NPP, and a month-by-month graph.
How to use it
- Transfers: choose a food chain and a transfer (or click an arrow), and choose whether to divide the first transfer by NPP or GPP.
- NPP: choose an ecosystem and a month, change the light and night warming, and choose whether to find NPP or R.
What it shows
- How to calculate the efficiency of energy or biomass transfer between trophic levels (5.10).
- Why transfers are incomplete and food chains are short.
- The relationship between GPP, NPP and plant respiration: NPP = GPP − R (5.9(i)).
Limits of the model
- All ecosystems and figures are fictional, chosen to match the lesson’s worked examples. Real values vary a lot from year to year and place to place.
- Each consumer level is treated as eating only the level below. Real food webs have omnivores and decomposer chains.
- Respiration follows a simple Q₁₀ of 2, with half of it at night. The monthly split is illustrative.
Guided tour · step 1 of 9
- In Food chain, just below these steps, the card in the simulator shows (2 220 ÷ 18 500) × 100 = 12.0%.
- Set Divide producers by to GPP (options: NPP, GPP) to see a common mistake.
Dividing by GPP gives 7.93%. But part of GPP was respired by the oaks themselves and never became leaf that caterpillars could eat.
Food chain
Questions
Check your understanding
Try each question before opening the suggested answer.
Practice question
Retrieval and explanation · suggested answer
NPP is 16 000 kJ m⁻² year⁻¹ and herbivores store 1 920 kJ m⁻² year⁻¹. Calculate percentage efficiency of this transfer.
Show suggested answer
(1 920 / 16 000) × 100 = 12%.
Practice question
Retrieval and explanation · suggested answer
Why should that calculation use NPP rather than GPP?
Show suggested answer
Primary consumers eat producer biomass. Part of GPP has already been used in plant respiration, so it is not in that biomass.
Practice question
Retrieval and explanation · suggested answer
Give two reasons the transfer is less than 100%.
Show suggested answer
Any two of: not all tissue is eaten; faeces; respiration (heat); excretion; death before consumption.
Take the idea further
Apply the same specification knowledge to an unfamiliar problem. Any extra assumptions are supplied in the question.
Stretch question
A student reports efficiency as 0.08 with no percentage, having divided consumer energy by GPP. The table listed GPP 40 000, R 12 000, consumer 2 240 kJ m⁻² year⁻¹. Correct the working.
Show a hint
Find NPP first.
Explore the reasoning
NPP = 40 000 − 12 000 = 28 000 kJ m⁻² year⁻¹. Efficiency = (2 240 / 28 000) × 100 = 8.00%. Reporting 0.08 hides the percentage and used the wrong denominator.
Recall this lesson
Lesson recall questions
Question 1 of 5: State the formula for percentage efficiency of energy transfer between trophic levels.
Efficiency of trophic transfers
Practice question
Retrieval and explanation · suggested answer
State the formula for percentage efficiency of energy transfer between trophic levels.
Lesson: 5C 1: Transfers Between Trophic Levels
Try this from memory first.
Put your biology to work
Explore where these ideas appear in the world. Enrichment, not extra required recall.
An energy pyramid needs a measurement
5C · Transfers Between Trophic LevelsOpen University ecosystem materials treat ecosystems as living systems of energy transfer, from rainforests to microbial communities. That is the same idea as 5.10’s pyramid, scaled up. Their…Specification 5.10Read & use the scienceClose article
Why this matters
Open University ecosystem materials treat ecosystems as living systems of energy transfer, from rainforests to microbial communities. That is the same idea as 5.10’s pyramid, scaled up. Their examples are enrichment; your calculation still uses the kJ you are given. An energy pyramid is a quantified model, not a census of individual organisms. Choosing a boundary and a time interval matters: a seasonal food web can change even when the same species remain present.
Back to the specification
Pearson Edexcel IAL Biology · Issue 2, February 2021 · Unit 4, pp. 29–32. The application extends beyond required recall.
- 5.10 know how to calculate the efficiency of biomass and energy transfers between trophic levels
Use the science
Why is a photograph of a food web not enough to report a transfer efficiency?
Explore a possible response
A web shows who eats whom. Efficiency needs measured energy or biomass in successive trophic levels, with units and time.
Explore the source
- OpenLearn: ecosystems as living communitiesThe Open University
Plankton fuel an ocean food web
5C · Transfers Between Trophic LevelsNOAA describes phytoplankton as photosynthetic organisms at the base of many marine food webs. A large bloom can support more grazing organisms, but it does not transfer every…Specification 5.10Read & use the scienceClose article
Why this matters
NOAA describes phytoplankton as photosynthetic organisms at the base of many marine food webs. A large bloom can support more grazing organisms, but it does not transfer every unit of captured energy to fish. Producers respire, organisms are not wholly eaten, and consumers lose energy in waste and heat. This is why an ocean food-web picture cannot supply a percentage transfer efficiency on its own. Fisheries scientists need productivity measurements at specified trophic levels and over a stated time interval. A fish catch can change because of fishing pressure even when primary production stays similar.
Back to the specification
Pearson Edexcel IAL Biology · Issue 2, February 2021 · Unit 4, pp. 29–32. The application extends beyond required recall.
- 5.10 know how to calculate the efficiency of biomass and energy transfers between trophic levels
Use the science
If a bloom doubles phytoplankton biomass, why need fish biomass not double?
Explore a possible response
Transfers are inefficient, predators may be limited by other factors, and fishing or migration can change the fish population independently.