
What you need to know
- 4.17species richnessThe number of different species in an area. in a habitatThe place where an organism lives., and heterozygosityA measure of genetic diversity: H = number of heterozygotes ÷ number of individuals, for one gene locus. index within a speciesA group of organisms that can interbreed to produce fertile offspring..
- 4.18Index of diversity D = N(N−1) / Σn(n−1) for comparing habitats.
Use the specification’s D, which is larger in more diverse samples, not Simpson’s 1−Σ(n/N)² unless a question prints that form. All numerical examples here are fictional teaching data. Sampling method, area and season must be comparable before you interpret two D values.
By the end, you should be able to…
- Calculate species richness and the heterozygosity index.
- Calculate D from N and each n, showing the working.
- Explain why two habitats can share richness but differ in D.
Build your understanding
Species richness is a count
species richnessThe number of different species in an area. is the number of different speciesA group of organisms that can interbreed to produce fertile offspring. in a habitatThe place where an organism lives., or in a defined sample of that habitat. Ten species means richness 10, whether one species is common or all ten are equally rare. Richness ignores abundance and ignores geneA sequence of DNA bases that codes for a polypeptide or a functional RNA. inside each species.
It is still useful. A first survey that only lists species can detect a very poor habitat. It cannot tell you whether one species dominates, so it is a weak comparison tool on its own.
Heterozygosity inside one species
genetic diversityThe variety of alleles in a population or species. within a species can be summarised with the heterozygosityA measure of genetic diversity: H = number of heterozygotes ÷ number of individuals, for one gene locus. index H = number of heterozygousHaving two different alleles of a gene. / number of individuals in the populationAll the individuals of one species living in one area at the same time.. You must say which locusThe position of a gene on a chromosome. or marker was scored. H ranges from 0 (no heterozygotes at that marker) towards 1.
A fictional class types 40 plants at one marker and finds 12 heterozygotes: H = 12/40 = 0.30. That is diversity at that marker in that sample, not a complete genome score. A plantation of one species can have richness 1 and still have a useful H if that crop is genetically mixed.
Index of diversity D
To compare habitats you also need abundances. The specified index is D = N(N−1) / Σn(n−1), where N is the total number of organisms counted and n is the number of each species. If every individual is the same species, Σn(n−1) = N(N−1) and D = 1, the minimum.
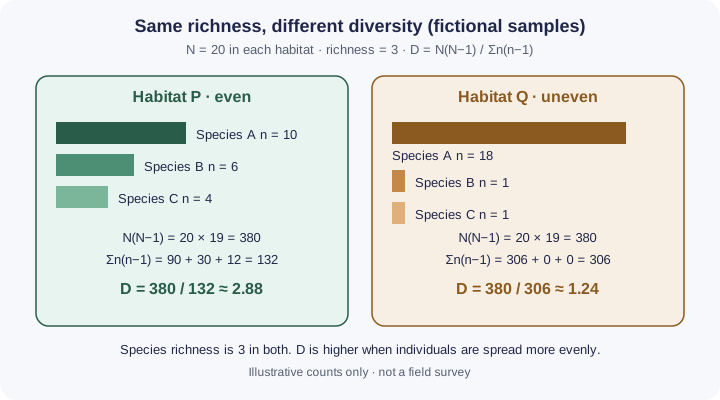
Worked fictional pair: both habitats have N = 20 and richness 3. Habitat P has n = 10, 6, 4. N(N−1) = 380. Σn(n−1) = 90 + 30 + 12 = 132. D = 380/132 ≈ 2.88. Habitat Q has n = 18, 1, 1. Σn(n−1) = 306. D = 380/306 ≈ 1.24. Same richness; Q is less diverse because one species dominates.
| Measure | Level | What a higher value means | A limitation |
|---|---|---|---|
| Species richness | Habitat | More species present in the sample | Ignores abundance and genetic diversity |
| Heterozygosity index H | Within one species | More heterozygotes at the scored marker | Depends on the locus chosen and on sampling |
| Index of diversity D | Habitat | Individuals spread across species (richness and evenness) | Invalid if sampling effort or identification differs |
Make your reasoning visible
Write the −1 terms
D uses N(N−1) and n(n−1). Dropping −1 is a different statistic.
Do not call D a percentage
It is a unitless index. Compare high versus low and show working.
Avoid this misconception
The claim: If two woods have the same number of speciesA group of organisms that can interbreed to produce fertile offspring. they are equally diverse.
The correction: Richness can match while one wood is dominated by a single species. D uses abundance and will then differ.
Two meadows each have three species. Are they equally diverse?
Species richness counts the species. The index of diversity also uses how many individuals of each species there are, so it can tell an even habitat from one that a single species dominates.
What the model shows
Fictional samples drawn individual by individual, with a bar chart of n and the working for D = N(N−1) ÷ Σn(n−1). Then one species typed at a genetic marker.
What to look for
Why Habitat Q has a lower D than P with the same richness. What happens to D when only one species is left, and when the sampling effort changes.
What it tells us
D = 380 ÷ 132 ≈ 2.88 for P and 380 ÷ 306 ≈ 1.24 for Q. D = 1 for a single species. H = 12 ÷ 40 = 0.30.
Be careful what you claim
Fictional data. Two D values can only be compared if the method, area, time, season and identification are the same.
Try it in the model: switch from Habitat P to Habitat Q and watch Σn(n−1) and D.
Measuring biodiversity
Count every individual in a fictional sample, calculate the index of diversity D step by step, see what sampling effort does, then measure genetic diversity within one species.
What you see
- A habitat sample with every individual drawn and labelled by species, a bar chart of n for each species and the full working for D.
- A hedge whose whole community is faded, with the individuals caught by a sweep ringed. A population of one species typed at a single marker.
How to use it
- Under Part, choose Diversity index or Heterozygosity.
- Diversity index: pick Habitat P, Habitat Q, Your own (four sliders) or Hedge with a 5- or 50-minute sweep.
- Heterozygosity: change the number of heterozygotes and the population size, or press a preset.
What it shows
- Species richness and the heterozygosity index H = heterozygotes ÷ individuals (4.17).
- The index of diversity D = N(N−1) ÷ Σn(n−1), and why habitats with the same richness can differ in D (4.18).
Limits of the model
- All counts are fictional teaching data. Species are labelled A to H rather than named.
- D here is the specification’s index. It is not Simpson’s 1 − Σ(n/N)², which is a different scale.
- The sweep model catches each individual independently. Real sampling also depends on behaviour, weather and identification.
Guided tour · step 1 of 10
- In Sample, just below these steps, Habitat P is shown (n = 10, 6, 4).
- Read D, then set Habitat to Q.
Both have N = 20 and richness 3. Q has n = 18, 1, 1, so Σn(n−1) = 306 and D = 380 ÷ 306 ≈ 1.24, against 2.88 for P.
Sample
Questions
Check your understanding
Try each question before opening the suggested answer.
Practice question
Retrieval and explanation · suggested answer
What is species richness?
Show suggested answer
The number of different species in a habitat or sample, not their abundances.
Practice question
Retrieval and explanation · suggested answer
A fictional population of 50 beetles includes 15 heterozygotes at one marker. Calculate H.
Show suggested answer
H = 15/50 = 0.30.
Practice question
Retrieval and explanation · suggested answer
In a fictional sweep-net, n = 10, 6 and 4. Calculate D.
Show suggested answer
N = 20, N(N−1) = 380, Σn(n−1) = 90 + 30 + 12 = 132, D = 380/132 ≈ 2.88.
Take the idea further
Apply the same specification knowledge to an unfamiliar problem. Any extra assumptions are supplied in the question.
Stretch question
Two students calculate D for the same hedge. One samples for five minutes, the other for fifty, and they identify insects to different taxonomic levels. Can you interpret the larger D as the better habitat? Explain.
Show a hint
Separate the formula from the sampling design.
Explore the reasoning
No. Longer sampling and coarser identification change N, the species list and each n. D then reflects effort and naming, not a fair habitat comparison. Standardise area, time, season and identification before comparing.
Recall this lesson
Lesson recall questions
Question 1 of 5: A fictional class types 40 plants: 12 are heterozygotes at a marker. Calculate H.
Species richness and heterozygosity
Practice question
Retrieval and explanation · suggested answer
A fictional class types 40 plants: 12 are heterozygotes at a marker. Calculate H.
Lesson: 4C 2: Measuring Biodiversity
Try this from memory first.
Put your biology to work
Explore where these ideas appear in the world. Enrichment, not extra required recall.
A global catalogue is not D
4C · Measuring BiodiversityThe IUCN Red List assesses extinction risk for named species using criteria such as decline and range. It is a conservation tool, not a substitute for calculating D…Specification 4.17 · 4.18Read & use the scienceClose article
Why this matters
The IUCN Red List assesses extinction risk for named species using criteria such as decline and range. It is a conservation tool, not a substitute for calculating D in a school quadrat. A habitat can have a high D of common invertebrates and still hold few threatened endemics, or the reverse. A conservation assessor asks whether a species may disappear. A field ecologist calculating D asks how individuals are distributed among species in a sampled habitat. A geneticist calculating the heterozygosity index asks a third question within one species. These measures can disagree without any of them being wrong because their denominators and purposes differ. Students should identify what was sampled, define N and n correctly, and avoid reading a global extinction-risk label as a substitute for local abundance data.
Back to the specification
Pearson Edexcel IAL Biology · Issue 2, February 2021 · Unit 2, pp. 21–24. The application extends beyond required recall.
- 4.17 know how biodiversity can be measured within a habitat using species richness, and within a species using genetic diversity by calculating the heterozygosity index: number of heterozygotes / number of individuals in the population
- 4.18 understand how biodiversity can be compared in different habitats using the formula to calculate an index of diversity (D): N(N−1) / Σn(n−1)
Use the science
Why might a woodland with a high D still be a poor site for an endemic plant?
Explore a possible response
D summarises the sampled community’s richness and evenness. It does not tell you whether a particular endemic is present or whether its habitat requirements are met.
Explore the source
- IUCN: the Red List of Threatened SpeciesInternational Union for Conservation of Nature
DNA traces are not a head count
4C · Measuring BiodiversityUS Geological Survey teams collect environmental DNA from water to detect species that may be difficult to observe directly. This can improve a biodiversity survey, but a DNA…Specification 4.17 · 4.18Read & use the scienceClose article
Why this matters
US Geological Survey teams collect environmental DNA from water to detect species that may be difficult to observe directly. This can improve a biodiversity survey, but a DNA detection is not automatically a count of individuals. Currents, shedding rates and contamination can affect results. To calculate the specification’s diversity index D, an ecologist needs numbers of organisms in each species in a defined sample; a presence-only eDNA list does not supply n. To calculate heterozygosity, genetic data from individuals of one species are needed. The case helps students choose the right measure for the question being asked.
Back to the specification
Pearson Edexcel IAL Biology · Issue 2, February 2021 · Unit 2, pp. 21–24. The application extends beyond required recall.
- 4.17 know how biodiversity can be measured within a habitat using species richness, and within a species using genetic diversity by calculating the heterozygosity index: number of heterozygotes / number of individuals in the population
- 4.18 understand how biodiversity can be compared in different habitats using the formula to calculate an index of diversity (D): N(N−1) / Σn(n−1)
Use the science
Could a water sample listing five fish species be used by itself to calculate D?
Explore a possible response
No. D requires counts of individuals in each species, not just presence. Sampling or a validated abundance method would be needed.
Explore the source
- Aquatic biodiversity monitoring with environmental DNAUS Geological Survey